

MTS Scanner
Institutional-Grade Market Analysis, Simplified for Your Screen
See the big picture, Your market command center
How the MTS Scanner Is Used
The MTS Scanner is designed to reduce market noise by highlighting areas where structure, alignment, and participation are present.
Scanning is used for awareness and prioritisation — not execution. MTS advanced scanner has evolved into a sophisticated "Command Center". It is designed to provide a high level bird's eye view of the Indian market and global assest simultaneously.
Opening Range Breakout Scanner
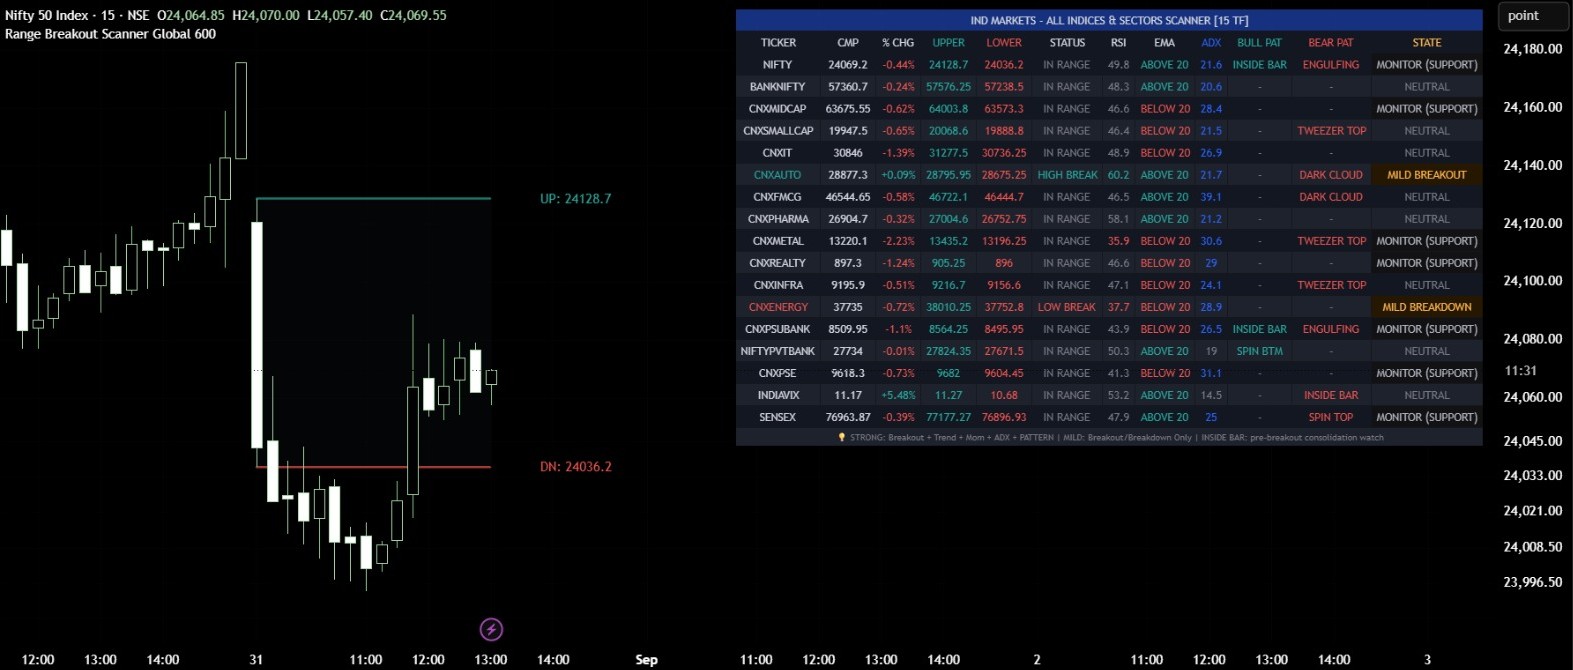
The MTS Opening Range Breakout Scanner tracks over 600 instruments across Indian and global markets simultaneously, highlighting structured breakout and breakdown conditions as they form. Rather than requiring manual condition-writing, the scanner comes pre-loaded with organised symbol groups — click a sector or asset class to instantly view its current breakout state on your TradingView interface.
Each symbol is evaluated across multiple timeframes (5-Minute, 15-Minute, 30-Minute, and 1-Hour) and classified into clear states: High Confluence Bull/Bear, Mild Breakout/Breakdown, Monitor (Support/Resistance), or Neutral — giving you objective market trend analysis and functioning as a powerful Bank Nifty intraday scanner without needing to manually scan each chart.
Candlestick Pattern Scanner
Built into the Opening Range Breakout Scanner is a candlestick pattern scanner covering 23 recognised patterns — from Morning Star and Bullish Engulfing to Evening Star and Bearish Marubozu. Bullish patterns are tracked in the context of a downtrend or below the 20 EMA, and bearish patterns in the context of an uptrend or above the 20 EMA, so pattern signals are read within their structural context rather than in isolation.
Advanced Demand & Supply Zone Scanner
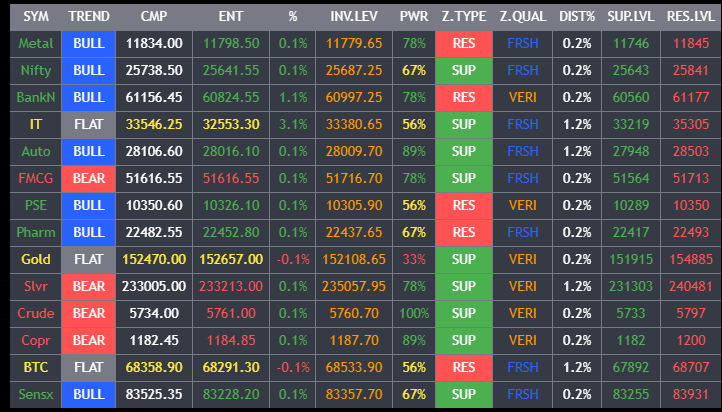
The MTS Demand & Supply Master Scanner automatically maps structural demand and supply zones across your chosen symbol list, tagging each zone as Verified or Fresh and tracking how many times a zone has been retested. This acts as an automated supply and demand zone indicator for TradingView, turning raw price structure into an organised, at-a-glance view of where institutional interest has previously shown up.
Trend Reversal Zones
Zones flagged with high retest counts or strong verification are treated as potential trend reversal zones — areas where prior participation increases the likelihood of a structural shift. The scanner separates these from freshly formed zones, so you can distinguish between an area the market is revisiting and one it's testing for the first time.
Risk-Reward Mapping
Every identified zone feeds into MTS Pro Suite's dynamic risk framework, which calculates a Baseline Price, Dynamic Invalidation level, and mathematical Target Zones (1:1 and 1:2) — giving you a defined risk-reward picture before you ever consider participation, rather than an arbitrary stop-loss guess.
Alerts for Demand and Supply Zones
Set alerts for demand and supply zones directly from the scanner so new zone formations, retests, or invalidations reach you without needing to watch the chart continuously.
MTS scanners deliver trend analysis for Nifty, Sensex, Bank Nifty, individual NSE stocks, major cryptocurrencies, and US markets — all from a single unified dashboard.
Sectoral Scanner Coverage
- Banking
- Information Technology (IT)
- Pharmaceuticals
- Automobile
- Public Sector Units (PSU)
- Metals
- Consumption & FMCG
- Energy & Infrastructure
Multi-Asset Scanner Coverage
- Gold
- Silver
- Crude Oil
- Copper
- US Markets
- Commodities Basket
- Bitcoin & Digital Assets
- Indices
- Global Markets
- Nifty / Sensex / Bank Nifty
Trading Styles, Timeframes & Context
MTS follows a top-down analytical approach. Higher timeframes define context and direction, while lower timeframes are used only for observation and refinement.
| Trading Style | Higher Timeframe (Context) | Observation Timeframe | What to Observe | Execution Context |
|---|---|---|---|---|
| Intraday | Daily / 60-Minute | 5-Minute / 15-Minute | Trend direction, momentum continuity, range versus expansion behaviour | Participation considered only when intraday behaviour aligns with higher-timeframe structure |
| Swing | Weekly / Daily | 4-Hour / 1-Hour | Pullbacks, consolidation phases, momentum resumption | Participation considered only in the direction of higher-timeframe trend |
| Positional | Weekly | Daily | Trend sustainability, structural zones, broader market cycles | Participation aligned with long-term structure rather than short-term noise |
Timeframe selection changes the lens — not the core logic. Higher-timeframe alignment always leads the decision process.
The Ultimate Intraday Stock Scanner for the Indian Market
Finding the right stock at the right time is the hardest part of day trading. The MTS platform serves as the ultimate intraday stock scanner for the Indian market, doing the heavy lifting so you can focus entirely on execution and risk management.
F&O Stock Breakout Screener
Options traders need volatility and momentum. Our F&O stock breakout screener constantly monitors the entire derivatives segment, alerting you the moment a highly liquid stock breaks out of its structural consolidation with supporting volume.
Sensex Intraday Momentum Scanner
For index traders, tracking the broader market pulse is vital. The Sensex intraday momentum scanner isolates the heavyweights driving the index, giving you clear visibility into whether the index is trending organically or being artificially held up by a single sector.
Swing Trading Stock Screener for India
If you prefer holding positions for days or weeks, our swing trading stock screener for India identifies assets pulling back to major daily and weekly demand zones, setting you up for low-risk, high-reward positional entries.
Spotting High-Probability Trend Reversal Zones
Catching a falling knife is dangerous, but buying at a verified institutional level is smart. The scanner excels at spotting high-probability trend reversal zones by combining extreme oversold readings with verified historical demand blocks.
Candlestick Pattern Recognition Software Integration
To provide final execution confluence, the scanner features built-in candlestick pattern recognition software. It will actively notify you when a bullish engulfing or hammer pattern forms exactly at a structural demand zone, providing the ultimate trade trigger.
Disclaimer
Important Disclosure & Risk Warning:- "Investment in securities market are subject to market risks. Read all the related documents carefully before investing."
Nature of Software:- The MTS Advanced Scanner is a proprietary technical analysis and data-visualization tool developed for the TradingView platform. It is an educational and analytical tool intended to assist users in their independent market research.
No Investment Advice:- This website and the MTS software do not provide investment advice, financial planning, or stock recommendations. We are not SEBI Registered Investment Advisers (RIA) or Research Analysts (RA). Any signals, labels, or alerts generated by the software are strictly the result of automated mathematical algorithms and do not constitute a recommendation to buy, sell, or hold any security.
User Responsibility:- Trading involves significant financial risk. The developer of MTS shall not be liable for any financial losses or damages resulting from the use of this software. Users are solely responsible for their trading decisions and are encouraged to consult with a certified financial professional before executing any trades.
Accuracy of Data:- While the logic is built on rigorous testing, we do not guarantee the accuracy or timeliness of third-party data feeds. Past performance of any automated logic is never a guarantee of future results.
