

About Us
What is MTS?
The MTS (Market Trend Structure) system was not built overnight. It is the result of 14 years of rigorous research, backtesting, and live-market refinement. Founded by an electronics engineer, MTS was born out of a profound frustration with the lagging, subjective nature of traditional retail indicators.
The MTS (Market Trend Structure) Suite is a premier, all-in-one trading ecosystem designed for high-precision technical analysis,MTS isn't just an indicator; it is a complete execution framework. Whether you are a scalper, day trader, or swing trader, MTS provides the objective data needed to trade alongside the "Big Money" with confidence, clarity, and consistency.
MTS is a decision-support and learning tool. It does not provide investment advice, trading recommendations, or guaranteed outcomes. MTS comes in two versions MTS Standard and MTS Pro Suite.
Beyond Basic Charting: A True Market Structure Shift (MSS) Indicator
Most retail traders rely on lagging indicators that tell them what happened yesterday. MTS was built to identify what is happening right now. We developed a sophisticated Market Structure Shift (MSS) indicator that reads live order flow and structural breaks, giving you a predictive edge rather than a reactive summary.
Built Exclusively as a Market Trend Structure
To deliver our complex algorithms without sacrificing speed, we engineered MTS specifically as a TradingView market structure indicator. This seamless integration gives you access to institutional-grade analytics directly within the world’s most popular, cloud-based charting platform.
Why We Engineered a Multi-Timeframe Alignment Scanner
Trading a 5-minute chart blindly is a recipe for disaster. We built our multi-timeframe alignment scanner to ensure you never take a trade against the macro trend. The system instantly evaluates the daily, hourly, and 15-minute structures, flashing green only when the stars align across all timeframes.
Moving Past Subjective Trendlines to Objective Data
Human emotion ruins technical analysis. By moving past subjective trendlines to objective data mapping, MTS forces you to view the market through a lens of strict, mathematical risk management and automated structural reality.
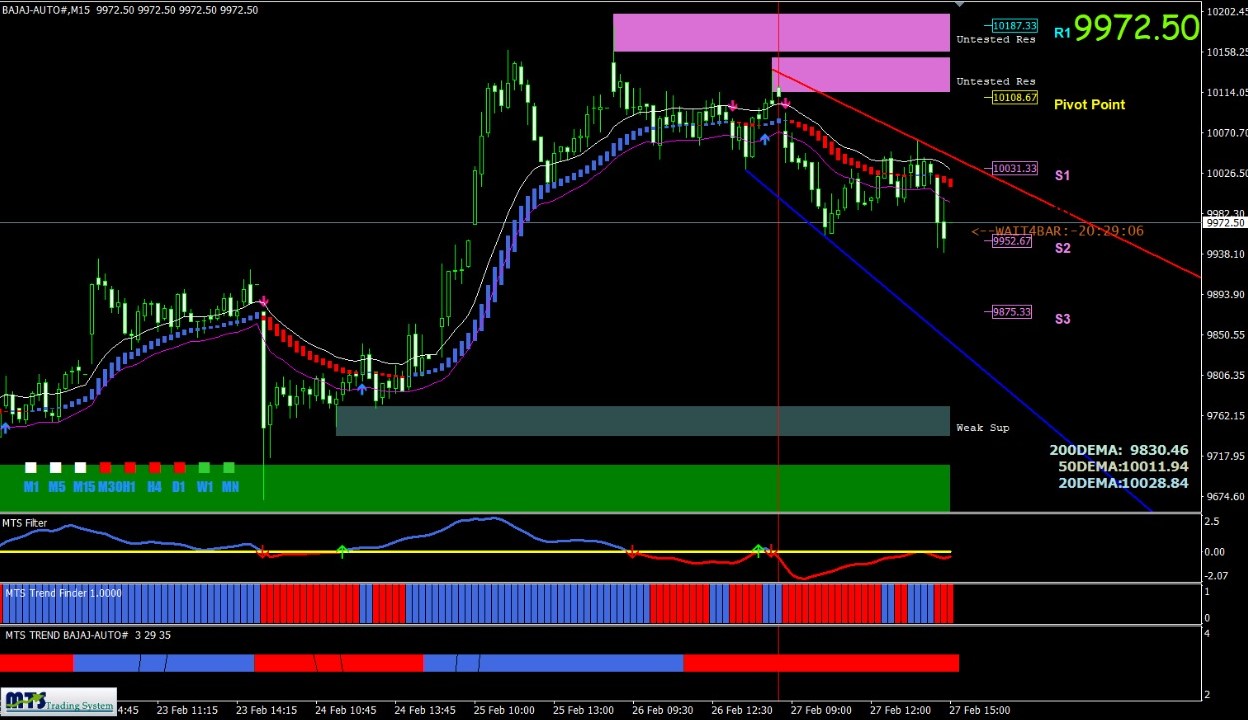
MTS Standard: The Core Analytical Foundation
The MTS Standard tier is designed for traders seeking absolute visual clarity over market direction and momentum. It strips away the noise of traditional charting, providing a clean, objective view of the market's underlying structure.
Instead of cluttering your screen with lagging indicators, MTS Standard focuses on the essential pillars of price action, acting as a robust decision support tool.
Core Features of MTS Standard:
Integrated Trend & Momentum Velocity: Instantly visualize the dominant market trend without second-guessing subjective chart patterns.
Automated Market Structure: Automatically plots critical support, resistance, and dynamic trend lines to frame your intraday setups.
The "No-Trade Zone" Architecture: The system maps market momentum using dynamic parallel tracking lines. When price compresses between these lines, it is strictly identified as a "No-Trade Zone," keeping you safely on the sidelines during low-probability, choppy conditions.
Objective Decision Support: Replaces emotional execution with analytical clarity, helping you identify high-probability areas of interest based on strict market mechanics.
MTS Pro Suite: The Ultimate Command Center
The MTS Pro Suite is the pinnacle of the MTS ecosystem. Built for serious day traders and scalpers, this suite synthesizes a massive backend confluence of 17 to 18 technical indicators into a single, seamless dashboard.
It takes the structural foundation of the Standard version and supercharges it with dynamic risk management, multi-timeframe alignment, and live options integration.
Exclusive Features of the MTS Pro Suite:
Intelligent Analytical Tags: Receive real-time "Focus LONG" or "Focus SHORT" visual tags on your chart. Backed by a proprietary Analytics Score, these tags provide deep market context rather than generic execution signals.
Multi-Timeframe Trend Matrix: A live, color-coded heatmap that instantly confirms structural alignment across all key intervals, from the 1-minute chart up to the weekly timeframe.
Dynamic Risk & Target Mapping: Automatically calculates and plots your exact Baseline Price, Dynamic Invalidation (stop-loss) levels, and Structural Target Zones tailored to live market volatility.
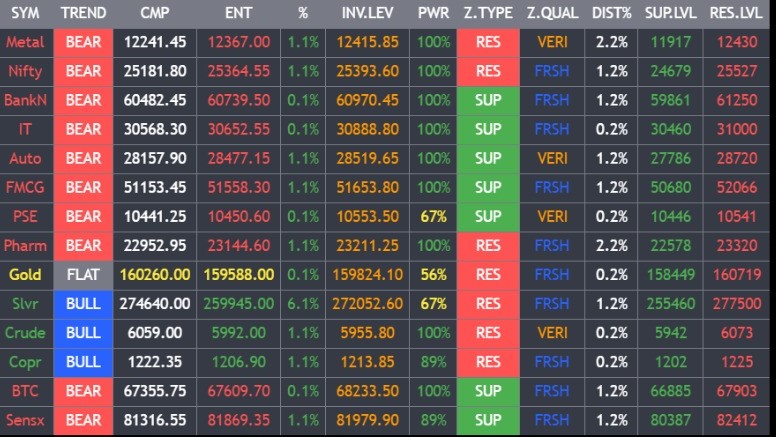
Curated Focus Watchlists: Built-in screeners continuously scan top-tier equities, organizing them into actionable LONG and SHORT focus lists based on Market Trend Analytics.
Key Highlights
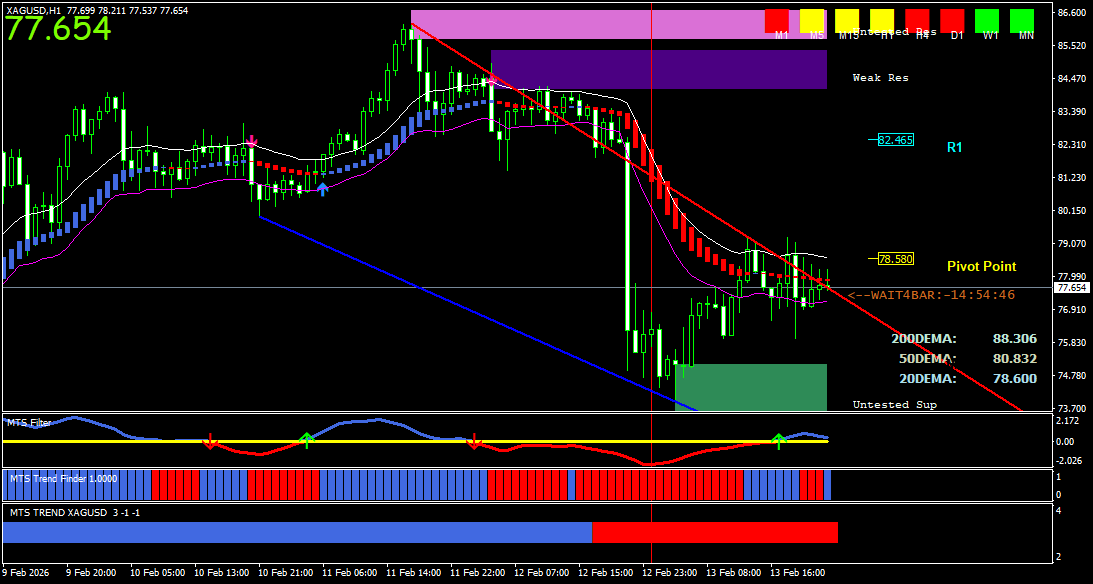
- Trend Ribbon View: Clear identification of bullish and bearish phases.
- Green Band Support Zones: Areas where buying interest previously emerged.
- Red Band Resistance Zones: Zones reflecting selling pressure.
- Flat Zone Detection: Highlights range-bound, low-momentum markets.
- Multi-Timeframe Trend Check: Structure alignment across M5, M15, 1H, 4H, D, W.
- Market Scanner: Quickly finds instruments with cleaner structure.
- The Multi-Asset and Sectoral Scanners are algorithmic filtering tools provided to assist users in their independent research. These tools do not "recommend" specific stocks for purchase. They provide objective, mathematical data based on price and volume.
How MTS Helps
Eliminates Emotion: Trading decisions are guided by defined rules rather than fear, greed, or market noise.
Saves Time: Automatically plots key levels and trends, reducing hours spent on manual chart analysis.
Provides Structure: Helps traders identify high-probability interaction areas and structural shifts.
Improves Discipline: Promotes patience by discouraging trades during unclear or choppy market conditions.
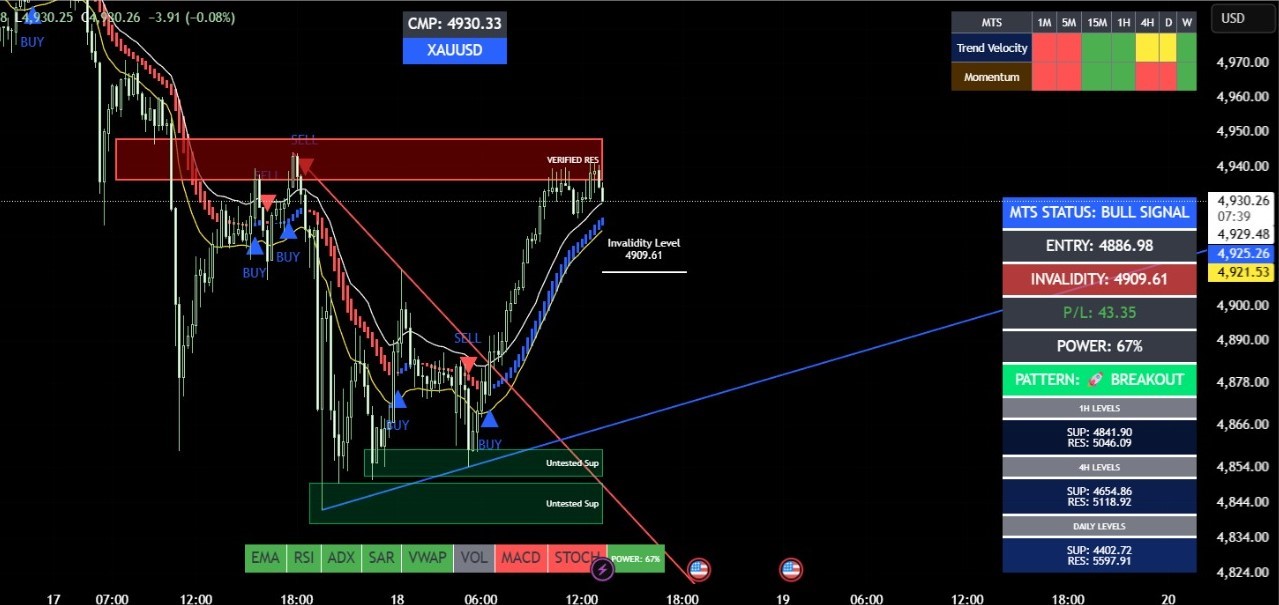
How You Use MTS
1. Assess Macro Context: Check higher timeframes to understand overall trend and key structural zones.
2. Identify Key Levels: Observe automated support, resistance, and demand/supply areas.
3. Wait for Confirmation: Look for structural shifts or momentum alignment before planning participation.
4. Define Risk: Use structural invalidation levels to manage risk objectively.
Who is MTS For?
Intraday & Swing Traders: Looking for objective trend and structural clarity.
Positional Investors: Wanting macro market structure alignment before capital deployment.
Beginners & Learners: Seeking a structured approach to understanding technical price action.

Disclaimer
Important Disclosure & Risk Warning:- "Investment in securities market are subject to market risks. Read all the related documents carefully before investing."
Nature of Software:- The MTS System is a proprietary technical analysis and data-visualization tool developed for the TradingView / MT4 platform. It is an educational and analytical tool intended to assist users in their independent market research.
No Investment Advice:- This website and the MTS software do not provide investment advice, financial planning, or stock recommendations. We are not SEBI Registered Investment Advisers (RIA) or Research Analysts (RA). Any signals, labels, or alerts generated by the software are strictly the result of automated mathematical algorithms and do not constitute a recommendation to buy, sell, or hold any security.
User Responsibility:- Trading involves significant financial risk. The developer of MTS shall not be liable for any financial losses or damages resulting from the use of this software. Users are solely responsible for their trading decisions and are encouraged to consult with a certified financial professional before executing any trades.
Accuracy of Data:- While the logic is built on rigorous testing, we do not guarantee the accuracy or timeliness of third-party data feeds. Past performance of any automated logic is never a guarantee of future results.
